In the intricate puzzle of a criminal investigation, we are obsessed with the classic questions: Who did it? What was the motive? But there’s another, equally crucial question that often holds the key: Where? Where did the crime happen? Where else has the offender struck? And most importantly, where do they call home?
Welcome to the world of forensic geography, a fascinating discipline where maps become as critical as fingerprints and spatial analysis becomes a detective’s secret weapon. It’s the art and science of understanding that crime is not random. It is geographically logical, and by decoding the map of a crime series, investigators can get one step closer to finding their suspect.
The Criminal’s Comfort Zone
At the heart of forensic geography is a technique called geographic profiling. The core principle is deceptively simple: just like you, criminals have a daily life. They have an “anchor point”—a home, a workplace, or another significant location—from which they venture out. This area of familiarity is their comfort zone, or what geographers call an “activity space.”
Most offenders don’t travel hundreds of miles to commit a crime; they operate in areas they know. This is driven by two key behavioral concepts:
- Distance Decay: This is a fundamental principle in geography. It states that the further you get from a central point, the less interaction there is. In criminology, it means an offender is more likely to commit a crime closer to their anchor point than farther away. The effort and risk simply increase with distance.
- The Buffer Zone: Paradoxically, criminals are least likely to offend right on their own doorstep. This creates a “buffer zone” immediately around their home or primary anchor point. Why? The risk of being recognized by a neighbor or local is too high. This often results in a “donut” pattern of crime, with a hole of inactivity in the middle of a cluster of offenses.
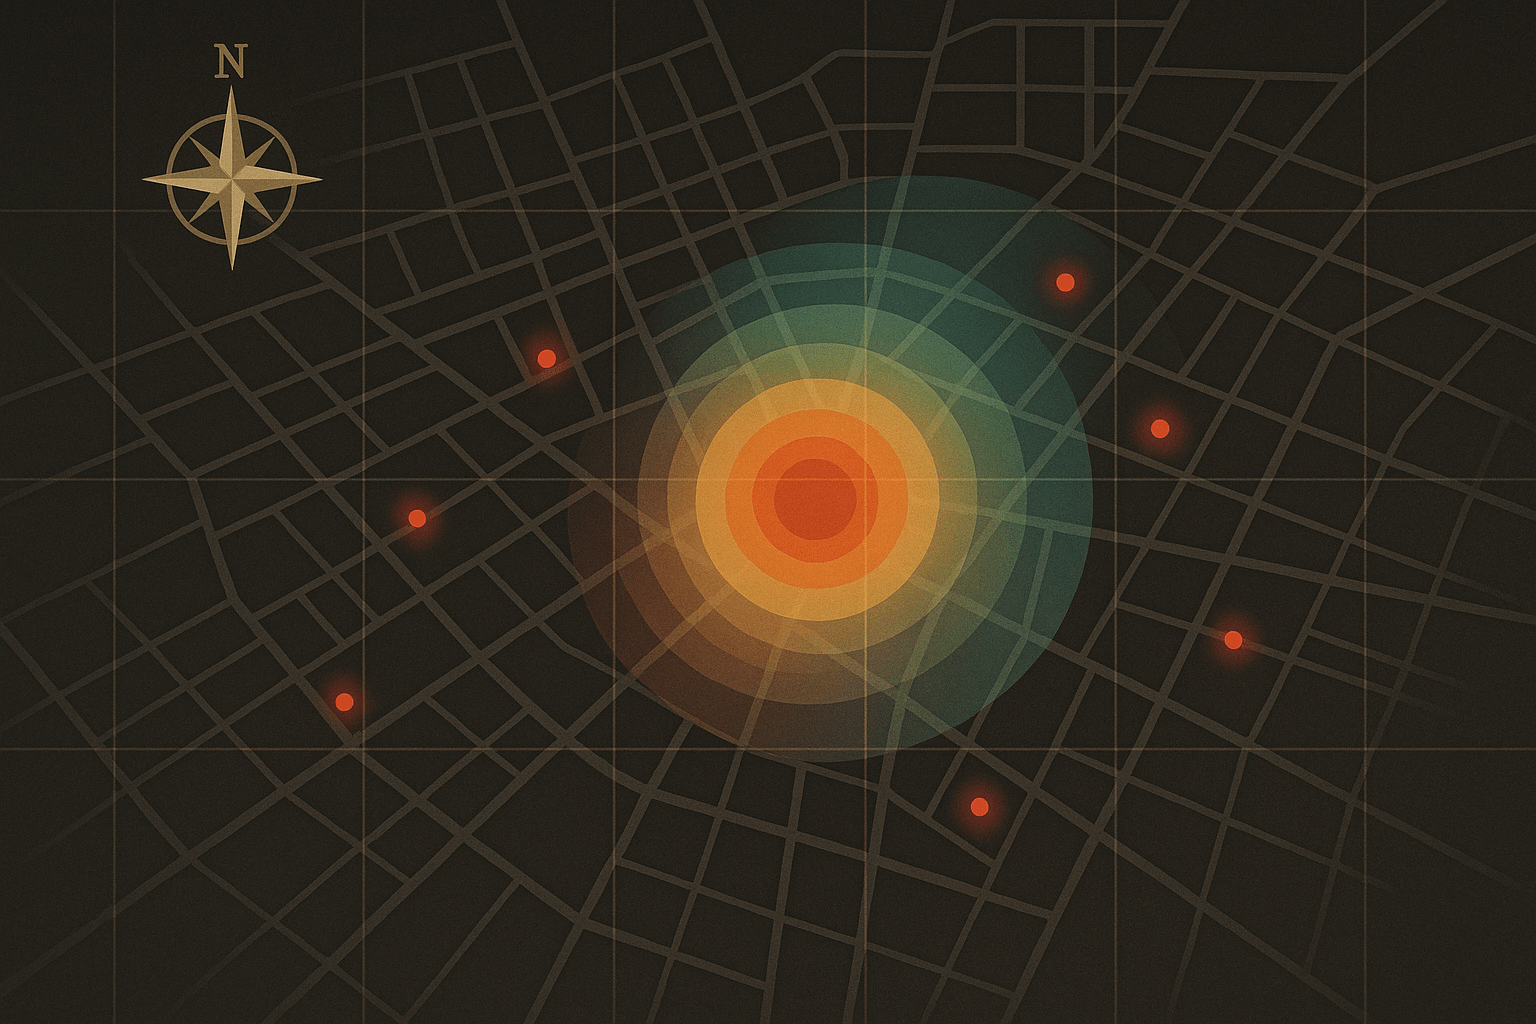
By analyzing the locations of a series of crimes, a geographic profiler can layer these principles to create a probability map. This isn’t a map with an “X” marking the spot, but rather a “jeopardy surface”—a heat map that shows the most probable areas where the offender lives or works. For police with thousands of suspects, this can narrow the search to a manageable number in a specific neighborhood, saving invaluable time and resources.
The Landscape as Accomplice: Physical Geography
The physical environment is far from a passive backdrop; it actively shapes criminal opportunity. The natural landscape can guide or hinder an offender, providing both pathways and barriers.
Rivers, coastlines, and mountain ranges often act as natural borders to a criminal’s hunting ground. For example, a series of crimes might stop abruptly at a major river, indicating the offender is unfamiliar with the area on the other side or sees it as a psychological or physical barrier. Conversely, a river valley or a trail system can serve as a secluded corridor for movement or a convenient place for body disposal, far from prying eyes.
Consider the case of a serial arsonist. A forensic geographer might notice the fires are all set in locations upwind from a major highway, allowing the smoke to blow away from a likely escape route. Or they might find that a killer is choosing victim disposal sites based on soil type—favoring soft, loamy soil in remote forests that is easy to dig. These are clues left not by the offender, but by the geography itself.
The Urban Maze: Human Geography in Crime
While physical geography sets the stage, human geography—the study of how people build and interact with their environment—is where most of the action happens. Our cities, towns, and road networks are the true playgrounds for criminal activity.
Think about the street layout of a city. An offender might prefer the anonymity and easy escape routes of a grid system with multiple access points to a highway. In contrast, they might avoid a suburb full of confusing cul-de-sacs, where a wrong turn could leave them trapped. Public transportation routes are also critical. A string of bank robberies along a specific subway line or bus route strongly suggests the offender is a “commuter” who uses that system to travel to their targets and make a clean getaway.
Socio-economic geography also plays a huge role. An offender might target affluent neighborhoods for burglary but will do so based on their own “mental map” of the area—knowing which streets have less traffic, which homes have more cover, and which access roads lead back to their own, likely less-affluent, home base. Different zones of a city offer different opportunities: industrial areas for property crime, entertainment districts for assaults, or red-light districts for predatory violence.
Putting Theory into Practice: The Maps of Infamous Crimes
Geographic profiling isn’t just theoretical; it has been instrumental in real-world cases.
Perhaps the most famous early example is the hunt for the Yorkshire Ripper in England. Between 1975 and 1980, Peter Sutcliffe committed a series of brutal attacks across several cities in Northern England, including Leeds and Bradford. When the crime locations were mapped, they showed a distinct cluster. A geographic analysis later showed that the center of this cluster was in the Manningham district of Bradford—precisely where Sutcliffe lived and worked as a truck driver. His hunting grounds were dictated by the roads he traveled and the cities he knew intimately.
A more complex case was the Washington D.C. Sniper attacks in 2002. The shootings seemed random and widespread, terrorizing the entire metropolitan area. This didn’t fit the classic “donut” model. However, when the locations were analyzed in relation to the road network, a pattern emerged. The vast majority of shootings occurred within a very short distance of major highways, particularly the I-495 Beltway. The offenders, John Allen Muhammad and Lee Boyd Malvo, were highly mobile, using their car as a base of operations and the highway system as their artery of movement. The profile correctly identified a “marauder” type of offender who travels along major transit routes.
From Pushpins to Pixels
Today, forensic geographers have moved far beyond pushpins and paper maps. They use powerful Geographic Information Systems (GIS) software to layer vast amounts of data. A single map can display crime locations, road networks, zoning laws, demographic data, bus routes, and even the locations of cell phone towers.
Complex algorithms run these data points through models like “distance decay” to produce the probability surfaces. The result is a powerful tool for strategic policing. Instead of knocking on every door, investigators can focus their efforts, prioritize suspect lists, and direct surveillance to the areas where the offender is most likely to be.
Geographic profiling is not a crystal ball. It cannot give you the offender’s exact address or name. But it is a compass. In the vast, often confusing landscape of a criminal investigation, it points detectives in the right direction, reminding them that to find the “who”, they must first understand the “where.”