This is the geography of touch, a world where information is conveyed not through color and symbols, but through texture, elevation, and even vibration. It’s a discipline that redefines what a map can be, transforming it from a visual document into a tangible experience.
From Carved Wood to Embossed Paper: A Brief History
The idea of a non-visual map is far from new. For centuries, indigenous cultures have used tactile methods to navigate. Perhaps the most famous examples come from the Inuit people of Greenland, who carved portable “maps” from driftwood. These small, handheld objects represented coastlines not as a bird would see them, but as a kayaker would experience them—feeling the sequence of inlets, islands, and headlands. They were maps of sequential experience, not of absolute position, perfectly suited for their purpose.
The modern era of tactile cartography for the blind began in earnest in the 19th century, alongside the revolutionary development of Braille. Early pioneers created maps using raised lines of string glued to wooden boards or by embossing heavy paper. These first maps were often simple, showing the outlines of countries or the paths of major rivers. The challenge, then as now, was one of translation: how do you convert the rich, dense information of a visual map into a format that can be coherently understood by fingertips?
The Language of a Tactile Map: Design Principles
Creating an effective tactile map is a masterclass in cartographic simplification and thoughtful design. A finger cannot take in an entire landscape at a glance the way an eye can; it must trace and explore information piece by piece. Therefore, clarity and a lack of clutter are paramount.
Cartographers in this field use a specialized “language” to communicate geographical features:
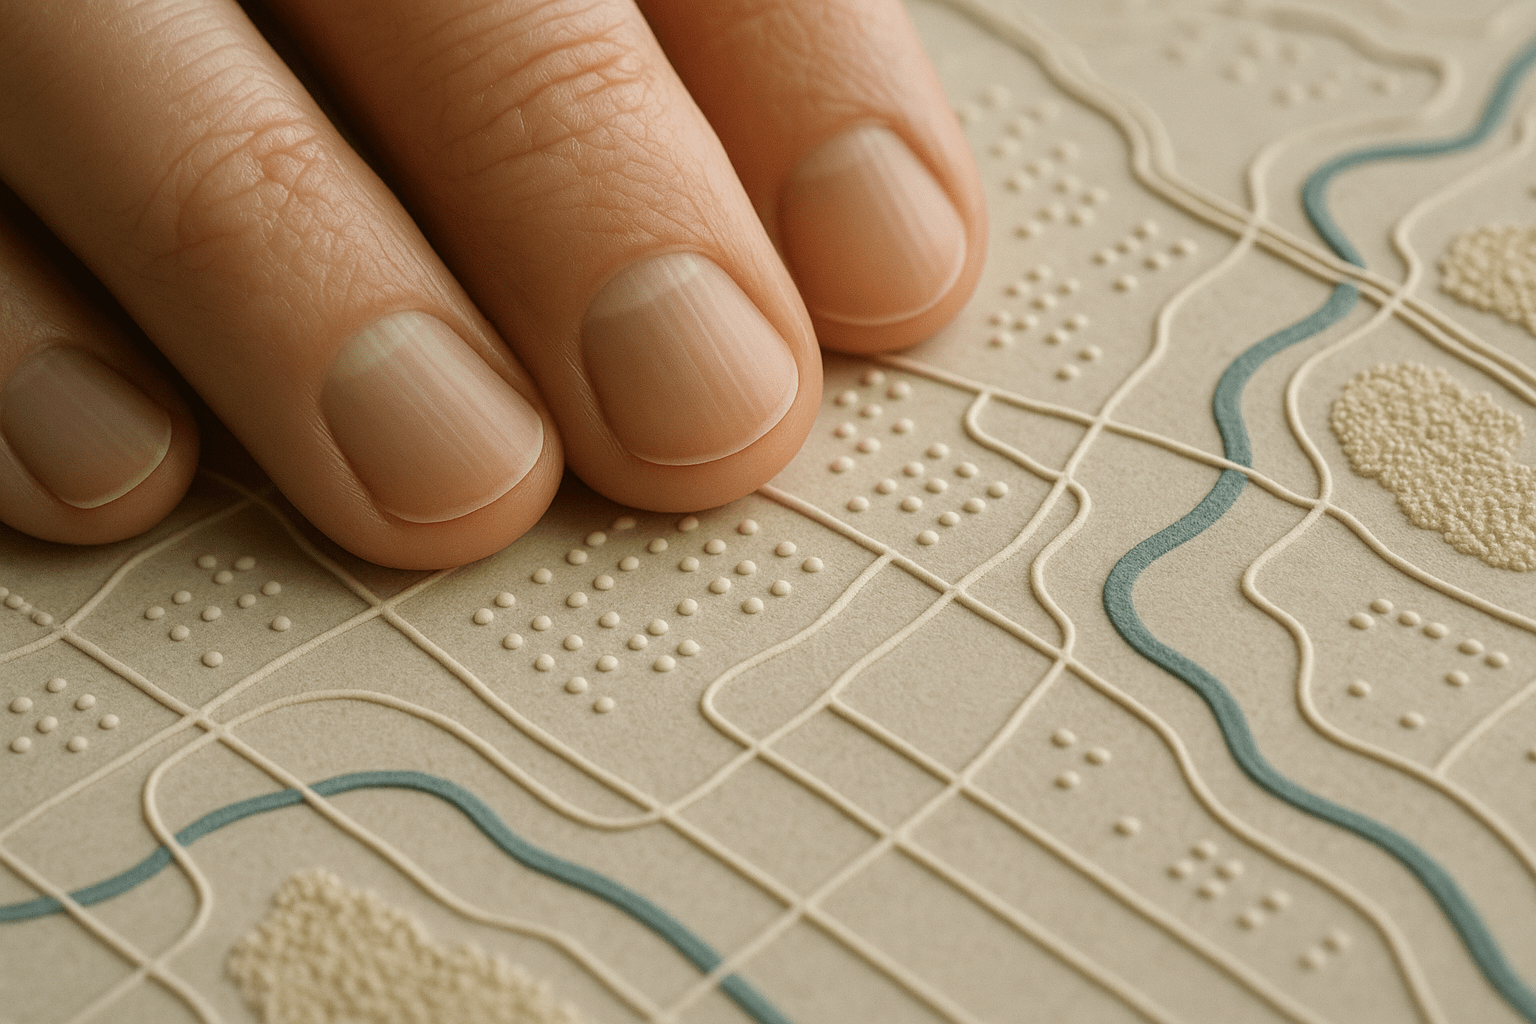
- Elevation and Lines: The most fundamental elements. Raised lines represent linear features like roads, rivers, and political borders. The height and thickness of a line can add information—a thick, high ridge for a major highway, a thinner, lower one for a local street. Coastlines are always a critical, clearly defined raised line.
- Symbols: Just like on a visual map, symbols denote points of interest. A small raised circle might indicate a city, a square could be a major building, and a distinct triangle could mark a subway station entrance. Consistency in symbolism is key for a user to learn the map’s language.
- Braille Labels: For text, Braille is essential. It’s used to label countries, cities, oceans, and to provide a key or legend that explains what each texture and symbol means.
– Texture: Different patterns and textures are used to represent areal data. A body of water might be smooth, while a park could be represented by a fine, sandy texture. A dense urban area might have a cross-hatched pattern, distinguishing it from a sparsely populated rural region shown with a wider dot pattern. This allows users to understand the character of a place, not just its outline.
The art lies in deciding what to leave out. A tactile map of a city can’t show every single street. Instead, the cartographer must select the most important arterial roads, landmarks, and public transit nodes to create a clear, navigable mental model for the user.
The Digital Touch: Haptic Technology and the Future
While physical tactile maps remain invaluable, especially in education, the field is being revolutionized by digital technology. This is where we move from purely tactile maps (static, physical surfaces) to haptic maps (dynamic, active feedback).
Imagine a tablet screen that is smooth to the touch. As a user drags their finger across it, an app uses a sophisticated array of tiny motors to create localized vibrations. As their finger crosses a country’s border, they feel a sharp “buzz.” As they move over a mountain range like the Andes, they feel a rumbling, high-frequency vibration that changes in intensity with the elevation. Moving their finger over the Amazon River might produce a softer, flowing sensation. This is haptic feedback.
This technology opens up incredible possibilities:
- Dynamic Data: Haptic maps can be updated in real-time. A user could feel the flow of traffic on a city grid, with congested roads vibrating more intensely. A geographer could display a weather map where temperature gradients are felt as changes in vibration frequency.
- Audio-Tactile Integration: The most powerful systems combine touch with sound. As you touch a location on a haptic map, a voice might announce, “Paris, France”, and then offer to read more information about it. Touching a point symbol could identify it as “The Louvre Museum.” This multi-sensory approach dramatically deepens the user’s understanding.
- 3D Printing: On the physical side, 3D printing has become a game-changer. Geographers and educators can now easily create highly detailed and accurate 3D topographic maps. A student can physically hold a model of a volcano and feel its caldera, or trace the path of a glacier through a U-shaped valley. This makes complex physical geography accessible in a way that was never before possible.
More Than a Tool: The Impact on Spatial Understanding
Haptic and tactile maps are more than just navigational aids; they are instruments of equity and education. They provide the foundation for spatial literacy—the ability to understand and reason about spatial relationships. For a visually impaired child, feeling the shape of Africa, the scale of Russia, or the proximity of Japan to mainland Asia builds a cognitive map of the world that is fundamental to a geographical education.
In human geography, a tactile map could use varying dot densities to represent population clusters, allowing a user to feel the difference between the densely packed Nile Delta and the sparse Sahara. In physical geography, one can feel the continental shelf drop off into the abyss. These maps empower users to not just know *where* things are, but to understand the *why* of their spatial distribution.
Ultimately, the geography of touch reminds us that cartography is a creative act of communication. By translating our world into a language of texture and vibration, haptic maps ensure that the ability to explore, understand, and connect with our planet is not limited by one’s ability to see.