Imagine a city silently, invisibly sinking. It’s not a scene from a disaster movie; it’s the daily reality for hundreds of millions of people in coastal and inland metropolises around the world. This slow-motion crisis, known as subsidence, threatens homes, infrastructure, and entire economies. But how do we track a phenomenon that happens at a snail’s pace, often just millimeters a year? The answer lies hundreds of kilometers above us, with a remarkable technology that acts as our planet’s surveyor: Interferometric Synthetic Aperture Radar, or InSAR.
This powerful tool is peeling back the surface of our world, revealing a hidden geography of movement and risk. From space, satellites are watching our cities sink, and what they see is changing how we plan for the future.
What is InSAR? A “Spot the Difference” Game from Space
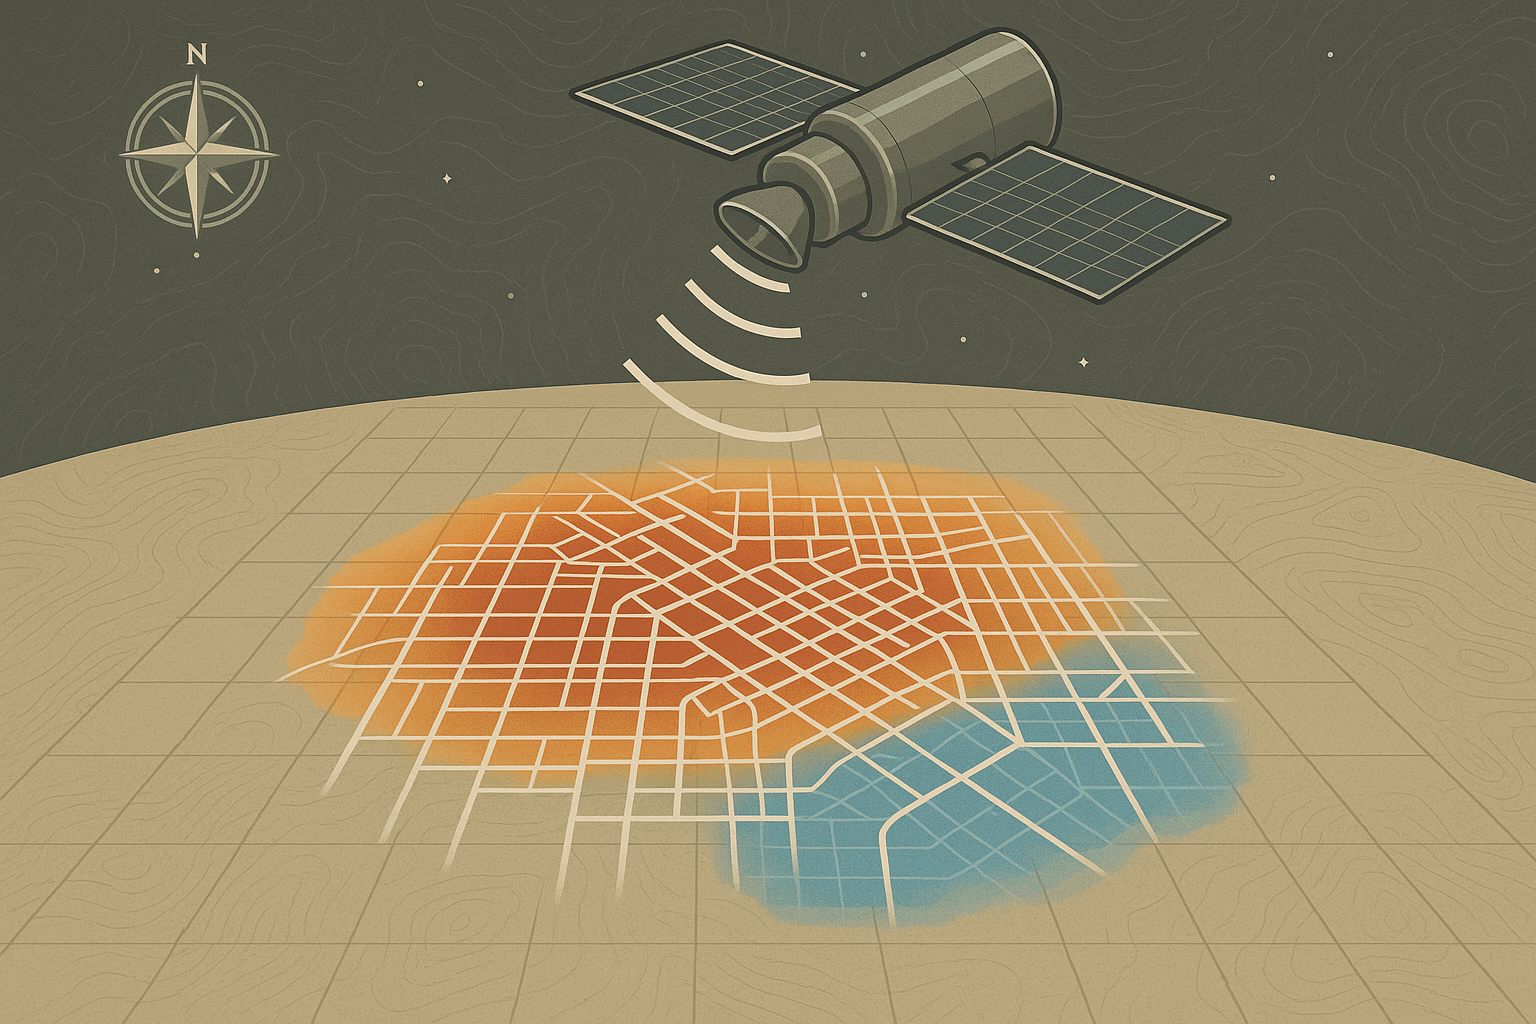
To understand InSAR, we first need to meet its parent technology, Synthetic Aperture Radar (SAR). Unlike a regular camera that needs light, a SAR satellite is an active sensor. It beams down microwave pulses towards the Earth’s surface and “listens” for the echoes that bounce back. Because it provides its own illumination, SAR can see through clouds, smoke, and even the dark of night. It’s like a bat using echolocation, but on a continental scale.
The magic happens with the “I” for Interferometry. Imagine a satellite flying over a city and taking a detailed SAR snapshot. Then, days or weeks later, it flies over the exact same path and takes another one. InSAR technology compares these two images, not just by looking at them, but by analyzing the phase of the returning microwave signals.
If the ground hasn’t moved an inch between the two satellite passes, the returning waves will be identical. But if the ground has sunk—even by a few millimeters—the distance the wave has to travel is slightly shorter. This tiny change in distance causes a shift in the phase of the returning wave. By measuring this phase shift across the entire image, scientists can create an incredibly precise map of ground deformation. The result is a vibrant, rainbow-colored map called an “interferogram”, where each full cycle of colors represents a specific amount of movement, giving us a detailed, millimeter-precision view of the ground’s behavior.
The Sinking Giants: A Global Tour of Subsidence
While natural geological processes can cause subsidence, the dramatic sinking seen in many of the world’s great cities is overwhelmingly a human-made problem. The primary culprit is the excessive extraction of groundwater. As aquifers deep beneath the surface are pumped dry to supply homes and industries, the layers of clay and sediment they once supported lose pressure and compact like a drying sponge. InSAR allows us to see exactly where and how fast this is happening.
Jakarta, Indonesia: The Race Against the Tide
As the capital of Indonesia, Jakarta is a sprawling megacity of over 10 million people, but it’s also the world’s fastest-sinking urban area. Decades of rampant and often unregulated groundwater pumping—a necessity for many where reliable piped water is unavailable—have taken a catastrophic toll. InSAR data reveals that parts of North Jakarta have sunk by more than four meters over the past few decades, with some areas currently sinking at an astonishing rate of up to 25 centimeters per year.
InSAR maps of Jakarta look like ominous, colorful bullseyes, with the most intense sinking centered on industrial zones and densely populated neighborhoods with the heaviest water extraction. This data hasn’t just been an academic curiosity; it has been a stark, visual wakeup call for the Indonesian government, providing critical evidence that helped drive the monumental decision to relocate the nation’s capital to Borneo.
Mexico City, Mexico: Sinking on an Ancient Lakebed
Mexico City’s subsidence problem is written into its very origins. The Aztec capital, Tenochtitlan, was famously built on an island in Lake Texcoco. The Spanish conquerors drained the lake, and the modern city rose on the soft, saturated clay of the ancient lakebed. Today, the metropolitan area’s 22 million residents draw heavily on the aquifer beneath them, accelerating the compaction of these unstable soils.
InSAR reveals that some parts of the city are subsiding by up to 50 centimeters per year—so fast you can almost see it. The effect is not uniform. This “differential subsidence” causes buildings to tilt, roads to fracture, and sewer lines to break. It also dramatically increases flood risk, as the city sinks further into its basin. InSAR monitoring helps authorities identify the most critically affected areas and provides invaluable data for managing the city’s C-Class water infrastructure and protecting its priceless historic buildings.
Venice, Italy: A Delicate Dance of Land and Sea
Venice is the quintessential sinking city, but its story is more complex. Major subsidence in the 20th century was caused by industrial groundwater pumping on the mainland. After these practices were halted in the 1970s, the rate of sinking slowed dramatically. So, is the problem solved?
Modern InSAR, from satellites like the European Space Agency’s Sentinel-1, provides the answer. The data shows that while the aggressive sinking has stopped, Venice continues to subside at a slower rate of 1-2 millimeters per year due to the natural compaction of lagoon sediments. This might sound trivial, but when combined with sea-level rise, every millimeter counts. InSAR provides the hyper-precise monitoring needed to assess the long-term stability of the city and the effectiveness of massive engineering projects like the MOSE floodgates, ensuring this fragile world heritage site can be protected for generations to come.
More Than Just Maps: The Human Geography of InSAR
The power of InSAR extends beyond physical geography; it cuts straight to the heart of human geography by exposing vulnerabilities and inequalities.
- Infrastructure at Risk: InSAR data can be used as an early warning system for civil engineers. It can flag sections of bridges, railways, and pipelines that are under stress from ground movement long before visible cracks appear.
- Environmental Injustice: InSAR maps often reveal that the fastest-sinking areas are poorer neighborhoods. These communities may be built on less stable land and often lack access to municipal water, forcing a reliance on the very private wells that worsen the problem beneath their feet.
- Enhanced Flood Modeling: By providing precise elevation changes, InSAR data allows for far more accurate flood risk models. For a coastal city like Jakarta, knowing which areas have sunk by another 10 centimeters is critical for planning evacuation routes and coastal defenses.
An Eye in the Sky for a Changing Planet
Urban subsidence is a slow, insidious threat, a geographical shift happening right under our feet. For decades, its true scale was hidden from view. But thanks to InSAR, we now have the ability to watch our world change with astonishing precision.
This technology transforms invisible movements into clear, actionable data, empowering scientists, city planners, and policymakers to confront the challenge. As our cities continue to grow and our climate continues to change, tools like InSAR are no longer just remarkable scientific achievements; they are essential instruments for navigating our future on a dynamic and ever-moving planet.