Take a moment to picture a world map. You probably envision the massive expanse of Russia stretching across the top, the familiar boot of Italy, and the vast, lonely continent of Australia. This map, likely a version of the Mercator projection, is our standard mental image of the planet. It’s great for navigation, but it tells a profoundly misleading story about the most important geographic feature of all: us.
What if we redrew the map not by square miles or kilometers, but by the number of people who live there? What if a country’s size was directly proportional to its population? Welcome to the world of the population cartogram, a map that throws our conventional view of the world out the window and replaces it with a startling, distorted, but deeply human-focused reality.
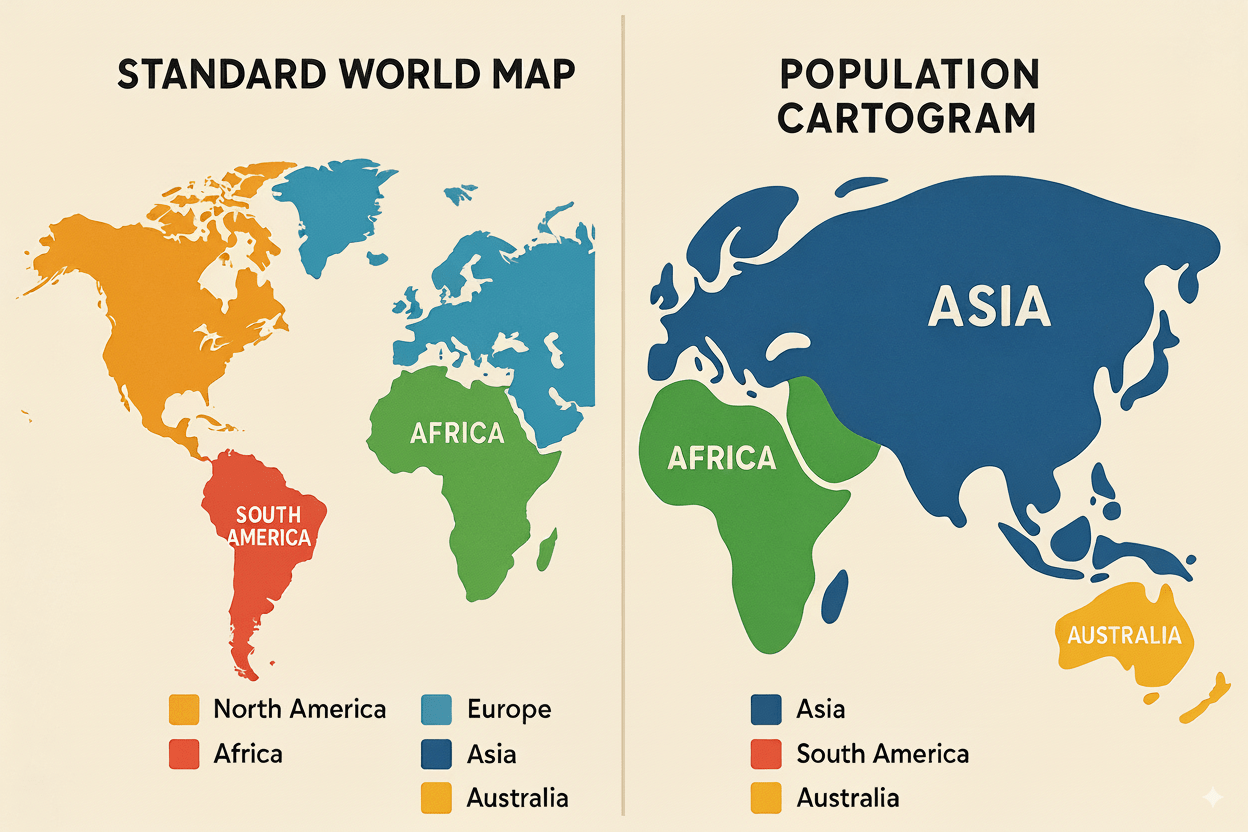
[Image: A standard world map, such as the Mercator projection, showing countries with their correct land area.]
What Exactly is a Cartogram?
A cartogram is a type of thematic map where the geometry of a region—be it a country, state, or continent—is distorted to reflect a specific data variable. Instead of land area, the map’s area represents something else entirely. While we’re focusing on population, you could create a cartogram for almost any dataset: Gross Domestic Product (GDP), carbon emissions, internet users, or even coffee consumption.
The goal isn’t geographic accuracy in the traditional sense. The goal is data accuracy. By warping the familiar shapes of countries, cartograms provide a powerful and immediate visual representation of data that a simple chart or table could never achieve. They force us to see the world through a new lens.
A World Reshaped: Before and After
When we apply this technique to the global population, the world we thought we knew becomes almost unrecognizable. Let’s explore the dramatic transformations.
[Image: A world population cartogram where countries are sized according to their population. India and China should be enormous, while Russia and Canada are very small.]
The New Superpowers: Asia’s Demographic Giants
The most stunning change occurs in Asia. On a population cartogram, this continent doesn’t just grow; it fundamentally dominates the map.
- India and China: These two nations swell to truly gargantuan proportions. Each boasting over 1.4 billion people, they become the two colossal centers of the human world, dwarfing nearly every other country. Their combined mass on the cartogram makes their demographic weight undeniable.
- South and Southeast Asia: It’s not just India and China. Countries we often perceive as geographically smaller become major players. Indonesia (over 275 million people), Pakistan (over 235 million), and especially Bangladesh (over 170 million) balloon into significant landmasses. Bangladesh, a country roughly the size of the U.S. state of Iowa, appears larger than Russia on a population cartogram.
- Japan: Though its population is declining, Japan (around 125 million) still appears as a densely packed and significant nation, far larger than its island geography would suggest.
The Incredible Shrinking Countries
Just as some countries inflate, others deflate dramatically, revealing how sparsely populated they are despite their immense size.
- Russia: The biggest loser in the land-for-people trade-off is Russia. The largest country on Earth by land area, stretching across 11 time zones, shrivels into a surprisingly modest shape. Its population of around 145 million is smaller than that of both Pakistan and Bangladesh.
- Canada: The world’s second-largest country becomes a thin, almost unnoticeable sliver bordering the much more substantial United States. With a population of just 40 million, its vast northern territories are almost empty of people.
- Australia: The continent-country of Australia shrinks to the size of a minor island. Its 26 million inhabitants are a tiny fraction of its neighbors in Southeast Asia, a fact starkly illustrated by the cartogram.
A New Look at the Continents
The cartogram doesn’t just change countries; it redefines entire continents and our perception of them.
Africa: The continent’s shape becomes lumpy and uneven. Nigeria explodes in size to become the undisputed giant of Africa, its population of over 220 million making it one of the largest entities on the entire map. Egypt and Ethiopia also become far more prominent. Meanwhile, the vast, empty spaces of the Sahara and the Namib deserts virtually disappear, as the land is worth nothing without people on it.
Europe: The continent remains a significant cluster of humanity. Germany, the United Kingdom, France, and Italy hold their own as densely populated nations. The cartogram visually represents Europe not as a collection of medium-sized states, but as one of the world’s major population centers.
The Americas: The United States remains a large and powerful presence, but its dominance is challenged. Mexico and Brazil assert their demographic weight, appearing much larger relative to the U.S. and Canada than on a standard map. The continent looks more balanced, reflecting the significant populations in Latin America.
Why This Distorted View is So Important
A population cartogram is more than just a cartographic curiosity; it’s a vital tool for understanding human geography and challenging our inherent biases.
- It Confronts Our “Mental Map”: We subconsciously associate a country’s land size with its importance. A cartogram shatters this illusion. It shows that influence, resource consumption, cultural output, and environmental impact are tied to people, not just territory.
- It Visualizes Density and Distribution: It’s one thing to read that Bangladesh is one of the most densely populated countries on Earth. It’s another to see it swell to a size larger than Russia. The map tells a story of urbanization, coastal living, and the immense pressure on resources in certain regions.
- It Provides Human Context: The map helps explain global phenomena. Why are issues of water scarcity so critical in India? Why is Nigeria such a significant cultural and economic force in Africa? The cartogram provides a visual baseline for understanding where human activity is concentrated.
By trading land for people, the population cartogram offers a more accurate depiction of the “human world.” It’s a powerful reminder that our planet isn’t defined by its empty deserts, frozen tundras, or vast oceans, but by the 8 billion of us who live here. It’s a world reshaped, not by tectonic plates or political treaties, but by the simple, powerful reality of where we call home.