Mapping the Uncounted: Creating Enumeration Areas
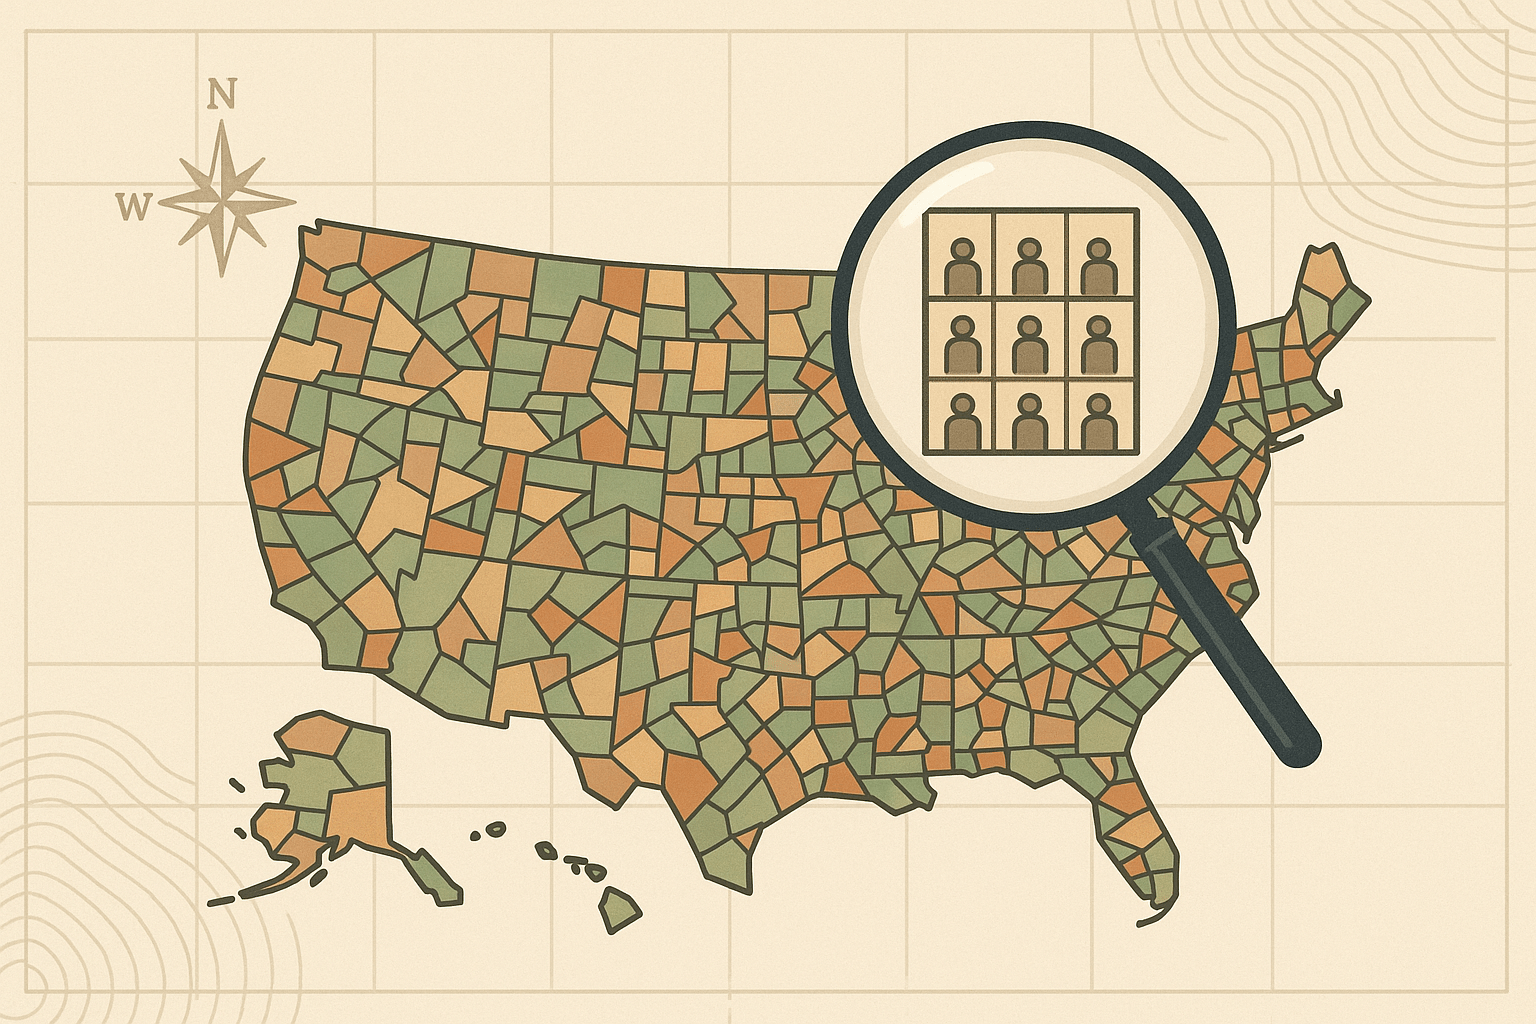
Before a single census taker, or enumerator, knocks on a door, an immense mapping effort is already underway. The first challenge is to divide the entire country into small, manageable pieces. These pieces are known as Enumeration Areas (EAs) or Enumeration Districts (EDs).
Think of an EA as a single enumerator’s workload. Its design is a careful science. Ideally, an EA contains a population that one person can survey within the census period. But more importantly, its boundaries must be clear, permanent, and unambiguous to the person on the ground. Planners rely on visible features that don’t change: rivers, major roads, railway lines, and coastlines. You cannot have a boundary line that cuts through a building or runs down the middle of a small, unnamed alley. Why? Because ambiguity leads to errors—either missing people entirely or counting them twice.
In the modern era, this process is powered by Geographic Information Systems (GIS). Cartographers at agencies like the U.S. Census Bureau or the UK’s Office for National Statistics layer satellite imagery, aerial photography, existing municipal maps, and previous census data to digitally draw these EAs. In the United States, the smallest geographic unit is the census “block”, often corresponding to a real-world city block bounded by streets. These blocks nest perfectly within block groups, which in turn form census tracts, creating a precise geographic hierarchy from a single block to the entire nation. This pre-count cartography creates the essential framework—a map of the uncounted—that makes the count itself possible.
Counting in the Margins: The Geographic Hurdles
Creating a perfect map of a nation’s settled, urbanized areas is one thing. But people, in all their diversity, don’t always live in neat, easily mapped grids. The true test of census cartography lies in accounting for populations at the geographic and social margins.
The Challenge of Remoteness
Physical geography presents formidable barriers. How do you count a handful of families living in a remote Amazonian village in Brazil, accessible only by a multi-day boat trip? Or a community in the vast, sparsely populated Siberian taiga? In the Australian Outback, census officials have developed specialized strategies to count remote Indigenous communities. This often involves a longer enumeration period, using light aircraft to reach distant settlements, and hiring local Indigenous people as enumerators who understand the language, culture, and landscape.
The Challenge of Mobility
Some populations defy the very concept of a fixed address. Nomadic and pastoralist groups, such as the Bedouin in the Middle East or the Maasai in Kenya and Tanzania, move with their herds according to seasons and resources. Counting them requires a different kind of map—one that is temporal as well as spatial. Census takers can’t go door-to-door, so they use alternative strategies:
- The Water Point Approach: Enumerators are stationed at key water sources or wells where groups are known to congregate.
- Synchronized Sweeps: A census is conducted over a very short, specific period (sometimes just one night) to capture a snapshot of the population before they move on.
- Community Mapping: Engaging with community elders to create hand-drawn maps of family groups and their typical seasonal territories.
The Challenge of Urban Complexity
Geographic challenges aren’t confined to the wilderness. The world’s sprawling megacities present their own cartographic nightmare. Informal settlements or slums—like the favelas of Rio de Janeiro or the makoko of Lagos—often grow organically, without formal addresses, street names, or official recognition. These areas can be a chaotic maze of makeshift structures, invisible on official city maps. Here, enumerators become explorers, often creating their own maps sketch-by-sketch as they navigate the community, ensuring every structure is marked and visited.
From Count to Constituency: Mapping Political Power
Once the immense task of counting is complete, the final and most powerful phase of census cartography begins: mapping the results. The raw numbers are translated into maps that dictate the distribution of political power and public resources for the next decade.
In many democratic countries, this process is known as reapportionment and redistricting. In the United States, for example, the census results determine how the 435 seats in the House of Representatives are apportioned, or divided, among the 50 states. A state with a booming population, like Texas or Florida, might gain seats, while a state with a stagnant or shrinking population, like New York or Illinois, might lose one. This shift in representation is a direct geographic outcome of the census.
Once a state knows its number of seats, it must redraw its congressional district boundaries. The principle is simple: each district should contain roughly the same number of people, upholding the ideal of “one person, one vote.” However, the practice can be deeply political. The way these lines are drawn on a map can determine which political party is more likely to win an election, a controversial practice known as gerrymandering. By “packing” opposition voters into a few districts or “cracking” them across many, map-makers can profoundly influence political outcomes for a decade to come.
Beyond Politics: Mapping for Services and Resources
The impact of census maps extends far beyond the halls of government. This data is the foundation for almost all public and even private sector planning. Where should a new hospital be built? Where is the demand for a new school or public transport line greatest? How should billions of dollars in federal funding for infrastructure, healthcare, and social programs be allocated? The answers are found in the detailed population density, demographic, and housing maps produced from the census. They tell planners where the elderly live, where young families are moving, and where infrastructure is most stressed.
A Living Map of a Nation
A census is far more than a statistical abstract. It is a living, breathing map of a nation at a single moment in time. It begins with the challenge of drawing a map to find every person, contends with the physical and human geography of the land during the count, and concludes by creating new maps that define our communities and our balance of power. It is the cartographic heartbeat of a country, the foundational story of who we are and, critically, where we are.